All OR bee hives have or will have varroa mites. It is important to know how many mites are present. Knowing how many mites provides an estimate of approximate risk of mites increasing fall colony losses. Starting sampling in July and continuing into October can trigger decisions on whether control might be needed to improve overwintering survival. Varroa mites are not the only pest/predator/pathogen than can seriously weaken or kill colonies but studies point to their being the most significant.
MITE MONITORING: To know how many mites, beekeepers need monitor/sample hives for mites. The PNWhoneybeesurvey asks percentage of OR hives monitored for mites during the 2016 year and/or 2016-17 overwinter, whether sampling was pre- or post-treatment or both and, of the five possible mite sampling methods, when and what method was used. Statewide, 178 individual respondents (63%) said they monitored all their hives and this group had a 43% loss. The 62 individuals (22%) who reported they did no monitoring had the statewide average loss of 48% while the 43 individuals who monitoring some of their colonies had a 60% loss.
The comparable numbers for WVBA respondents was 12 individuals (50%) who monitored all their hives had a 33% loss rate (for Langstroth hive keepers); three individuals who monitored some of their hives had a 60.5% loss while the nine individuals (37.5%) that did NO monitoring had 39% loss rate. SEE FIGURE 12.
The 15 individuals who indicated they did monitor (some or all hives) chose (from 5 selections) sticky boards (4 individuals) to 8 individuals who used Alcohol wash and the same number who visually looked on adults in colony. WVBA members who used powdered sugar had a 48% loss and the 7 using Alcohol had a 41% loss rate but statewide these two methods were the only two of the 5 choices for which users had better survival. WVBA members indicated they monitored pre-treatment (9 individuals), post-treatment (1 individual) and both pre-and post-treatment (5 individuals).

MITE CONTROL: The survey asked about use of several non-chemical mite treatments and also about use of chemicals for mite control. Four Willamette individuals, 17%, did not use a non-chemical control though these four all used a chemical control; they had a 75% loss. Six individuals did not use a chemical control (though all used a non-chemical treatment) and had a loss rate of 70.5%.
NON-CHEMICAL CONTROL: Respondents were offered 8 alternative, non-chemical mite treatments and could use a blank “other’ to indicate any additional techniques used (3 ‘other’ were listed). Of these non-chemical alternatives offered on the survey, use of screened bottom boards was selected by 200 individuals (71%) statewide and these individuals had slightly lower overwinter loss (45% compared to 48% average loss). Eighteen WVBA member respondents (90%, excluding the 4 who said none) indicated use of SBB with a loss rate of 30.5%, considerably lower than the 42.5% average loss of Langstroth hive users.
WVBA members checked 55 selections (2.3/individual) with one individual with 6 selections, one with five and four with four choices. Three had a single selection with two of those SBB. After SBB, painting hives a color/other distinctive ID measures was the selection of 11 members and minimal hive intervention/inspection the choice of 8 individuals. All remaining treatments were used by 4 or fewer individuals. Figure 12 shows the number of WVBA individuals in ( ) with the selection and the bar representing their loss. It is evident that a number of the treatments (i.e. requeen with hygienic queen, small cell/natural comb, drone brood removal, brood cycle break, screen bottom board and painted hives color/other distinctive hive ID measures, from lowest losses to closer to average 42.5% average WVBA losses) seemed to help reduce winter losses. Only SBB numbers are greater than 4 individuals.

Chemical Control: Use of a chemical control was indicated by 215 (76%) statewide OR beekeepers, 18 of them WVBA members. MAQS (formic acid) was the most common selection both statewide and for Willamette members (but only 6 WVBA individuals used it), followed. by Oxalic acid drizzle (5 individuals). The six individuals using MAQS had a loss rate of 18% and the five Oxalic acid drizzle users had a loss of16%. The two individuals using HopGuard II also had very low losses (17%). Figure 13 illustrates the number of users (in ( ) after selection) and their loss rate expressed as percent (and bar length).
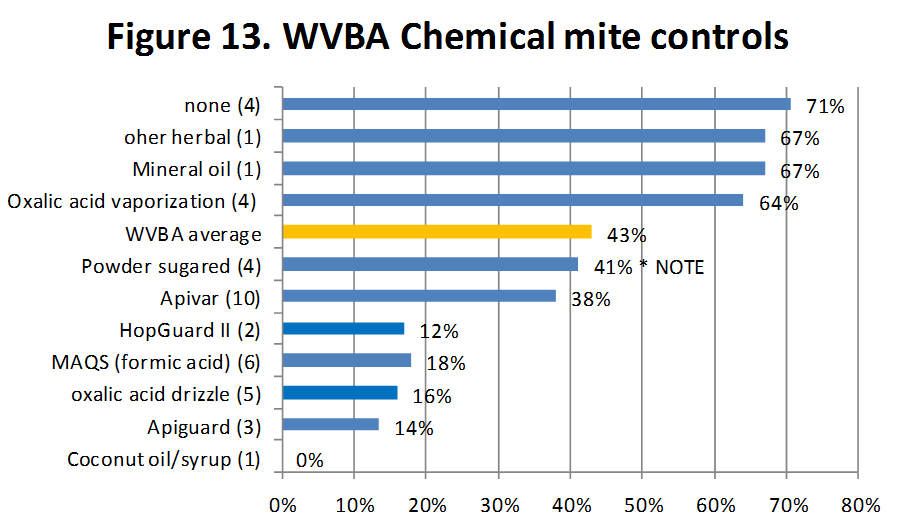
There were 37 total selections (2.1/individual). One individual used 4 materials and 5 used 3 different materials. There were 7 individuals using only a single material – 3 of them Apivar. Among the ‘other’ one individual indicated mineral oil and another said ‘other herbal’ but both had loss of 2/3rds of their fall colony number. One individual used 2 products Apivar and Coconut oil in syrup and had no losses of the 3 colonies (0% loss).
The website www.pnwhoneybeesurvey.com has this information and more (including these figures here), managements that assisted in lowering winter losses for WVBA. Under to bar click on survey reports and for 2016-17 the side bar for Individual club reports and scroll down o WVBA to view the club-specific results. Statewide results are under the 2016-17 report itself. Thanks to all who participated.