At the March and April WVBA meetings, I distributed paper copies and directed members to a web-based colony loss survey, a continuing effort to define overwintering success of backyard beekeepers in Oregon. This was the 9th year of such survey activity. I received 282 responses from OR backyarders, keeping anywhere from 1 to 48 colonies; Willamette Valley members sent in 24 surveys, 4 fewer than the previous year survey; WVBA colony numbers were lower (124 vs 144 last year).
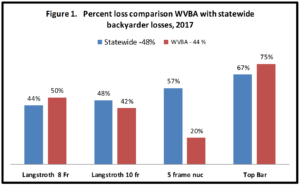
Overwintering losses of WVBA respondents was 54 colonies = 43 ½ %, slightly lower than the statewide loss of 48% (database of 282 OR backyarders.) Percent losses, determined by hive types, are shown in Figure 1 comparing WVBA with OR statewide backyarders. WVBA member respondents started winter with 93 Langstroth 10-frame and 22 Langstroth 8-frame hives and 5 5-frame nucs; there were an additional 4 Top Bar hives. Losses by hive types was essentially the same as statewide, except nuc losses were lower. The loss levels are show graphically below.
Fall 8 frame= 22; 10 frame=93; 5-frame nuc=5; Top bar=4= 124 Spring 8 frame= 11; 10 frame= 54; 5-frame nuc=4; Top bar=1= 70
The survey also asked for hive loss by hive origination. Respondents reported very similar loss levels of colonies starting as overwintered colonies (43%), newly established packages (50% but only 4 reported by WVBA beekeepers), swarm captures (44%) and feral transfers (only 6 of which 3 survived – 50%). Losses were similar to the statewide Oregon beekeepers. The exception was WVBA members had much better subsequent success with colonies established from nucs – 14 of 17 survived for only an 18% loss rate, well below the stateside average of 44%.
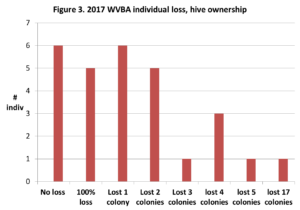
Not everyone had loss. Six individuals (40%) reported total winter survival; 5 individuals lost 100% of their colonies. Six individuals lost 1 colony, 5 lost 2, 1 lost 3 and 3 lost 4 colonies; one individual lost 17 colonies, the heaviest loss. Data shown graphically below in Figure 3. Forty-five percent indicated acceptable overwinter loss of zero to 10% and an additional 50% said up to 25%.
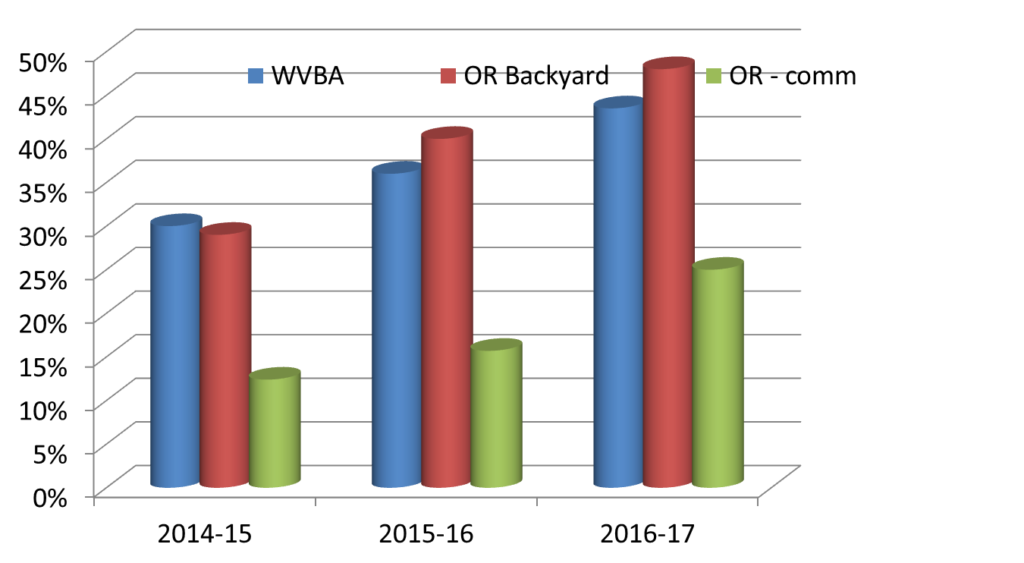
Compared with previous loss levels, the losses in 2016-2017 winter by WVBA backyarders were higher than the average of the previous two seasons by 10 percentage points (25% higher). As with last season, WVBA losses were lower than the statewide loss level; commercial OR beekeepers have ½ the losses of backyarders.
Figure 4. Comparison of WVBA overwinter losses with OR statewide beekeepers.
Typical of the statewide data, the WVBA respondents are largely new beekeepers. 54% of WVBA respondents had no or only 1 or 2 spring colonies; the largest number was 10. Seventy percent (70%) had 1, 2 or 3 years of experience with only 8% indicating 10 or more years experience; 43 years was the longest. One individual had more than one apiary location. Two individuals moved bees during the year, one for pollination, one due to home relocation.
The survey also asked questions about managements of Feeding, winter preparations, Sanitation, Screen bottom boards and monitoring and treatment for mites. The full report of results can be found on the pnwhoneybeesurvey website with discussion of why bees die and what individuals did in their management options that might have reduced loss levels. This will be posted in next couple of weeks.


